See
The clinic, in numbers.
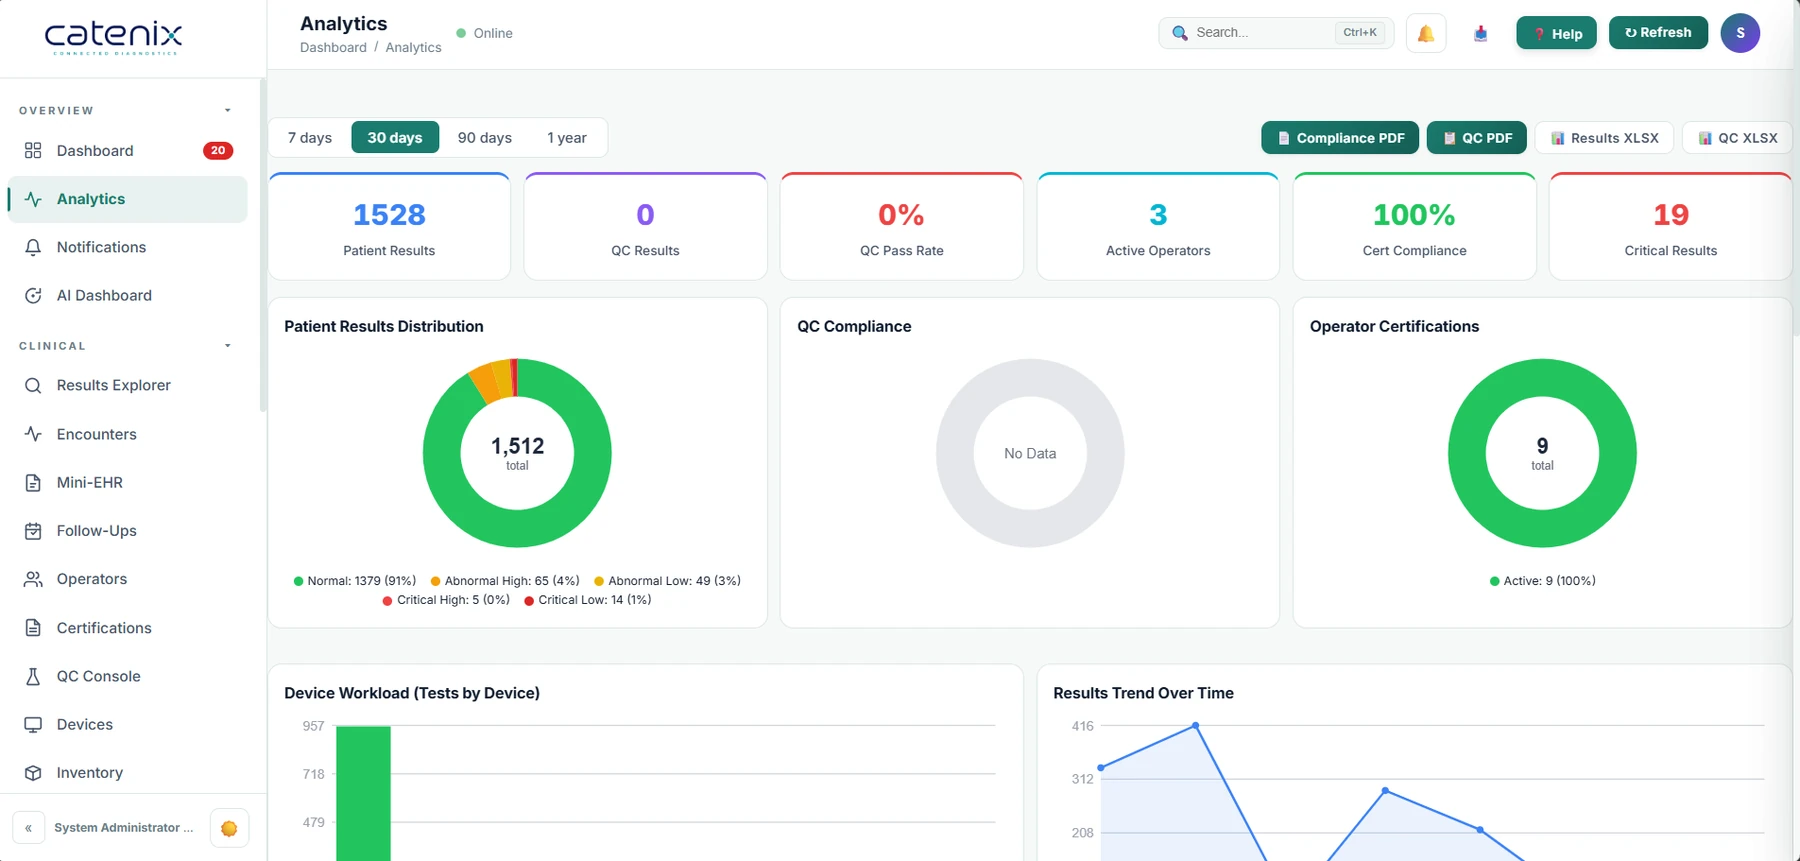
Analytics across results throughput, QC compliance, operator certifications, device workload and result trends. The operational picture a coordinator needs, refreshed live. The AI concierge helps people find features, understand the platform and look up their own tenant's data. Read-only, SaMD-safe by design, and it does not interpret clinical results.
- Operational analytics: throughput, QC, certifications, device workload
- Result-trend views over time, as produced by the analyser
- AI concierge for help, navigation & tenant-scoped lookups, read-only
- Tenant-scoped at two layers: context and query

Operational analytics
One view of the whole operation.
A hard boundary
The assistant and analytics are for running the clinic: help, navigation, operational metrics and looking up your own data. The assistant is read-only: it can answer from your tenant's records, never write to them. Catenix is connectivity, workflow, record-keeping and data display. It does not interpret results, calculate clinical values, classify or flag results clinically, suggest a diagnosis, or provide clinical decision support. To the assistant, a result is a record to retrieve, never a value to judge. Any reference range or note shown is clinic-authored content Catenix displays.
Book a demo
See the operational picture.
We'll show analytics and the assistant working within a single tenant's data.